If you are researching the prop trader failure rate you will quickly find claims that about 70% of traders fail within their first 30 days. The problem is this number is often repeated without explaining where it came from, what kind of trader this applies to, or if it means losing money, quitting, failing a prop challenge, or breaching a funded account.
That makes all the difference.
This breakdown is for beginning traders and newer prop traders who want to know why accounts fail early. It is not made for traders who want a guaranteed strategy, a fast way to get funded or a prediction that a certain risk model will make them profitable.
The evidence does seem to suggest that most retail day traders struggle to trade profitably. Academic research has shown again and again that only a small percentage get positive results after costs. One large study of Taiwanese day traders found that around 20% had positive abnormal returns after adjusting for relevant costs, while another long-term analysis found that profitable traders accounted for only about 5% of the day-trading population in its sample. The first-month number, however, needs to be treated with more caution.
Is the 70% prop trader failure rate accurate?
There is no widely established academic dataset proving that exactly 70% of all prop traders fail within their first 30 days.
Some recent prop-trading publications make much higher claims. One 2026 analysis from PropScorer claims to have analysed more than 50,000 funded accounts and reports a 41% failure rate in month one, followed by additional failures in months two and three. However, the underlying dataset and methodology are not independently established in the source, so this should be treated as an industry claim rather than a definitive market-wide statistic.
Another recent prop-firm education source claims roughly 70% of failures are caused by maximum-loss or daily-loss violations. That is a different statistic. It does not mean 70% of traders fail. It means that, according to that source’s reported data, loss-limit breaches account for about 70% of failures.
This is an important distinction.
A trader can fail because of:
- A drawdown breach
- A daily loss violation
- A rule violation
- Running out of time
- Abandoning the account
- Losing money consistently
- Becoming unprofitable after costs
Those are not interchangeable definitions of failure.

What the research actually tells us
The strongest evidence comes from broader day-trading research rather than proprietary-firm marketing statistics.
A major study examining Taiwanese day traders between 1995 and 2006 found that the vast majority lost money. In an average year, around 450,000 people participated in day trading, and among active day traders, only about 20% generated positive abnormal returns after costs.
Another academic analysis found that profitable day traders made up only about 5% of the trading population over its long sample period. It also found that unprofitable traders accounted for approximately 65% of day traders and around 74% of trading volume.
These studies do not support a 70% first 30 day failure rate. They make a more useful point: trading failure is a stubborn problem, but the exact failure rate depends a lot on how you define failure and what group of traders you are measuring.
That’s the number beginners should be focusing on.
Why traders fail so quickly
Early trading failure usually isn’t caused by one losing trade.
It tends to be a sequence.
A beginner takes a normal loss. Instead of accepting it as part of the strategy, the trader increases position size on the next setup. The next trade loses too. Now the trader feels pressure to recover the account, so a third trade is taken outside the original plan.
At this point, the strategy may no longer be responsible for the result.
The trader has changed the risk model.
This is particularly dangerous in prop trading because the account has hard boundaries. A trader might have a strategy that could theoretically survive a 10% drawdown, but the firm’s maximum loss might be substantially smaller.
The strategy and the account therefore have to be compatible.
The first 30 days expose risk-management problems
The first month tends to reveal whether a trader understands the difference between market risk and account risk.
Imagine a trader risking 2% on every trade.
Five consecutive losses produce:
2% × 5 = 10%
A trader with a 10% personal drawdown tolerance might consider this an unpleasant but survivable sequence.
A prop account with a much smaller maximum drawdown cannot necessarily tolerate the same approach.
Now consider a trader risking 0.5% per trade.
Five consecutive losses equal:
0.5% × 5 = 2.5%
The strategy has not changed. The market has not changed. Only the position risk has changed.
This is why a strategy can appear profitable during backtesting but still be unsuitable for a particular prop firm’s rules.
The challenge creates a second problem
Prop traders face a problem that ordinary retail traders may not experience in exactly the same way.
They are not simply trying to make money.
They are trying to make money without violating a predefined risk structure.
That creates competing objectives.
A trader might have a 10% profit target and a 5% maximum drawdown. If the trader risks 1% per trade, five consecutive losses can potentially consume the entire drawdown allowance.
If the trader reacts by taking on more risk to reach the target faster, the odds of hitting the loss limit go up.
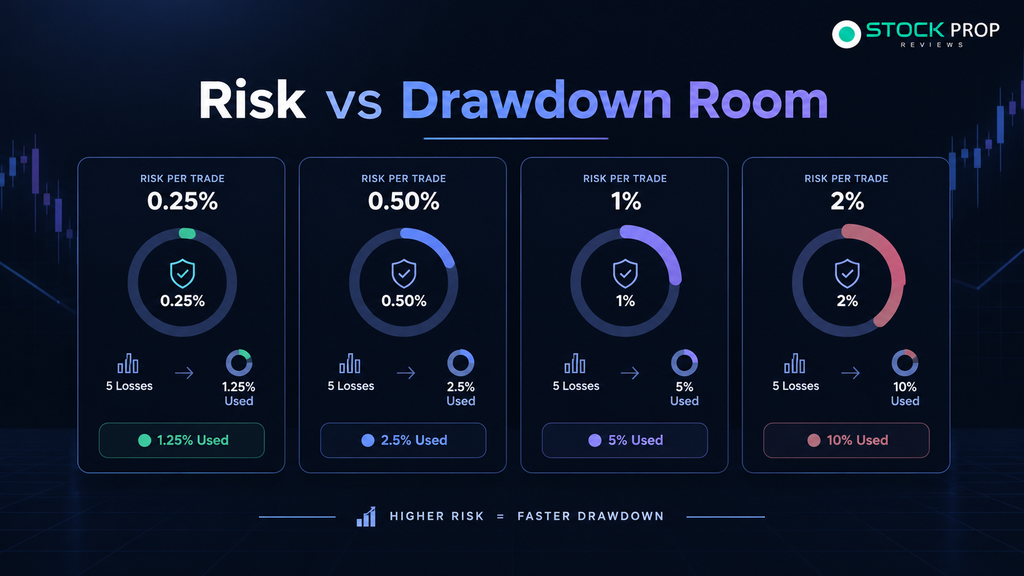
This is the familiar cycle:
Small loss → frustration → bigger position → bigger loss → recovery trade → drawdown breach
The point is that the final breach is often several decisions from the original error.
The mistakes competitors often leave out
Most articles about trader failure focus on familiar topics such as psychology, education and discipline. Those factors matter, but they do not fully explain why otherwise competent traders fail prop evaluations.
The missing piece is often risk architecture.
A trader can have a valid strategy and still fail because the strategy produces drawdowns that are incompatible with the firm’s rules.
For example, a swing strategy may historically experience an 8% peak-to-trough drawdown. Putting that strategy into an account with a 5% maximum loss creates an obvious structural problem.
The trader does not necessarily have a bad strategy.
The account may simply be too restrictive for that strategy.
The same applies to scalpers. A strategy that needs many attempts to capture small moves can be damaged by commissions, spreads, slippage and execution conditions. FXStreet highlights excessive leverage, poor risk management, transaction costs and overtrading among the recurring problems affecting retail traders.
That is something traders need to calculate before buying an evaluation, not after losing one.
The psychology of the first losing streak
Psychology becomes dangerous when it changes position sizing.
Suppose a trader begins with $100,000 of notional capital and risks 0.5% per trade.
The first loss is $500.
That is manageable.
The trader then sees another setup and risks 0.5% again. Another $500 loss occurs.
The trader is now down $1,000.
Nothing unusual has happened.
But if the trader thinks, “I need to make that back today,” the third trade may suddenly become 1.5% or 2%.
The market has not changed.
The trader has.
This is how a statistically normal losing sequence can become an account-threatening event.
FTMO trader interviews provide similar examples. Traders have described having to adjust risk management around maximum-loss rules, while others have reported that emotional reactions during drawdown caused them to deviate from their original plan.
These are individual trader accounts, not proof of a universal failure rate, but they illustrate the mechanism clearly.
A prop account magnifies small mistakes
The biggest misconception among beginners is that a funded account gives them more room to make mistakes.
Usually, the opposite is true.
The headline account size can be large, but the usable risk budget is much smaller.
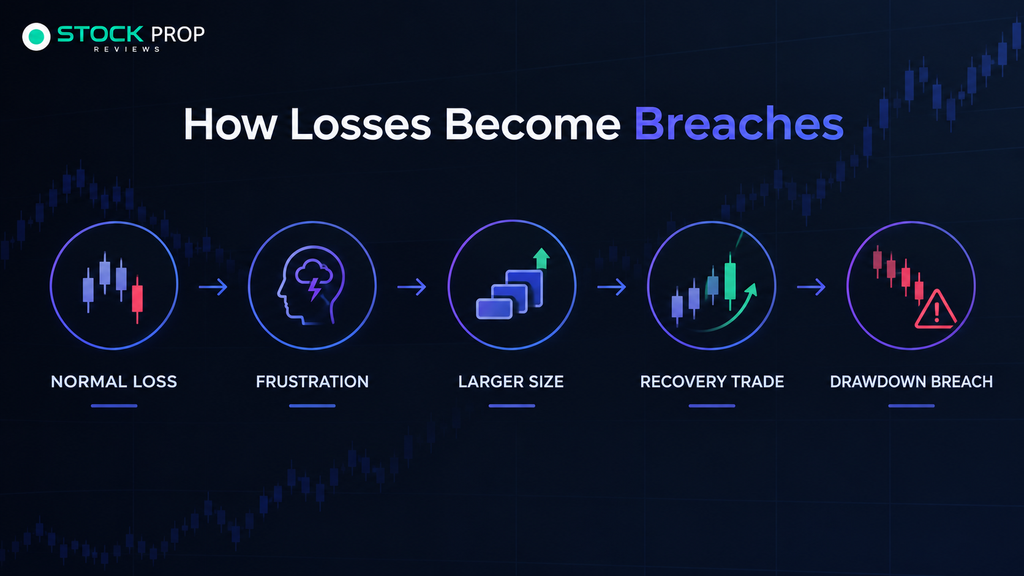
Consider a simplified $100,000 account:
| Risk per trade | Five consecutive losses | Drawdown used |
| 0.25% | 5 × 0.25% | 1.25% |
| 0.50% | 5 × 0.50% | 2.50% |
| 1.00% | 5 × 1.00% | 5.00% |
| 2.00% | 5 × 2.00% | 10.00% |
The important number is not the $100,000 headline.
It is the drawdown room.
A trader risking 1% per trade has much less room for a normal losing streak than a trader risking 0.25%.
This is one reason the prop trader failure rate cannot be separated from risk sizing.
Common mistakes during the first month
The same behavioural errors appear repeatedly.
Oversizing after a loss
The trader increases risk because the previous trade lost. This converts a normal statistical event into a larger account-level problem.
Trading to hit the target
A profit target can create artificial urgency. Instead of waiting for setups, traders begin looking for trades because they need a certain percentage.
Ignoring open drawdown
Some traders monitor closed P&L but underestimate unrealised losses. Depending on the firm’s rules, open positions can affect the account’s drawdown calculations.
Changing strategies too quickly
A trader has three losses in a row, and immediately changes from breakout trading to mean reversion, then scalping. A month later, there is no reliable dataset to tell us whether or not any approach actually worked.
Revenge trading
This is one of the most damaging patterns. A trader stops thinking about the next valid setup and starts thinking about recovering the previous loss.
The next trade becomes emotionally connected to the previous one.
That is where risk often expands.
What a trader should measure instead
Rather than asking only, “How much did I make this month?”, track four numbers.
Rule adherence: Did you follow the trading plan?
Risk per trade: Did actual position risk remain within the intended range?
Maximum drawdown: How far did the strategy fall from its peak?
Strategy expectancy: Over a meaningful sample, did the setup produce a positive result after costs?
These numbers tell you more than a single profitable week.
A trader who makes 8% while breaking their rules may be learning very little. A trader who makes 1% while following a tested process may have generated much more useful information.
This is also why the difference between passing a challenge and surviving a funded account deserves attention. Passing proves that a trader reached the firm’s evaluation requirements. It does not establish that the same risk model can be repeated indefinitely.
Our FTMO review and E8 Funding review examine this issue from the perspective of drawdown structure and trader behaviour rather than focusing only on advertised account sizes.
Who should be particularly cautious?
Beginners should be cautious if they have never tested their strategy across different market conditions.
Scalpers should calculate the impact of spreads, commissions, slippage and execution before assuming that a high trade frequency is an advantage.
News traders need to understand exactly how the firm’s rules treat high-impact events.
Swing traders need to check overnight, weekend and drawdown restrictions before selecting an evaluation.
And traders who need a specific monthly income from trading should be especially careful. Financial pressure can change decision-making and encourage traders to increase risk when they are losing.
A useful [prop firm comparison] should therefore include more than profit splits. Drawdown methodology, consistency rules, trading restrictions, payout conditions and execution limitations can matter more than an advertised 90% split.
Trade The Pool and risk transparency
For stock traders, TradeThe Pool is another model worth examining because its published program terms explain its risk framework, trading requirements and restrictions. Its program documentation states that risk management is mandatory and that trading conditions can differ between evaluation and funded stages.
One correction is important here: TradeThe Pool should not be described as a regulated prop firm. Its own website states that the online prop-trading arena is not yet regulated, so calling the company a “regulated stock prop firm” would give readers a misleading impression.
What can be said accurately is that it is a stock prop firm with published rules and risk requirements, which traders can review before committing to an evaluation. Its terms also disclose that regulatory or legal changes can affect its services.
Readers can get up to 10% discount when purchasing through our TradeThePool link.
That discount should not be treated as a reason to buy an evaluation. The relevant question is whether the firm’s current rules fit your strategy and risk tolerance.
For another perspective, our [truth about prop trading] coverage looks at why “funded capital” does not automatically mean low-risk trading.
The bigger lesson from the first 30 days
The first 30 days are not a reliable test of whether someone will become a profitable trader.
They are, however, a useful period for exposing weak processes.
A trader who repeatedly increases size after losses has a risk problem.
A trader who changes strategies after every losing streak has a testing problem.
A trader who cannot explain the firm’s drawdown calculation has a rule-understanding problem.
A trader who needs to hit a specific monthly income target may have a pressure problem.
None of these automatically means the trader’s strategy has no edge.
That distinction is important.
Academic evidence shows that long-term profitable day trading is difficult, but it also shows that the outcome is not identical for every trader. Historical research found a small group of traders who generated positive abnormal returns, while experience and persistence can influence outcomes.
The useful question is therefore not simply, “What percentage of traders fail?”
It is:
What causes a trader to lose the ability to continue trading?
In prop trading, the answer often comes down to the interaction between strategy drawdown, position sizing, firm rules and behaviour under pressure.
That is far more actionable than an isolated 70% statistic.
FAQs
How many prop traders are successful?
There is no single, universally verified prop trader failure rate for all firms and all traders. There is a lot of variation in the public claims as different definitions of failure are used by firms and researchers. Academic research on day trading reveals most retail day traders don’t make consistent profits, but that research shouldn’t be used as direct stats for modern prop firms. (ScienceDirect)
Are 70% of traders losers after 30 days?
There’s not a lot of independent evidence to support that 70% is a universal failure rate in the first 30 days. Some recent industry sources report high early-failure rates, but with different datasets and definitions. For example, one source reports 41% failure in month one of a claimed 50,000 funded accounts. (PropScorer) Why do prop traders die so fast?
Why do prop traders fail so quickly?
Common causes are too big positions, drawdown breaches, revenge trades, overtrading on targets, not understanding the rules of the account and changing strategy without enough data. Because prop accounts have hard risk limits, it is very important to not exceed your loss-limit.
So, does passing a prop challenge mean a trader is making money?
No. Passing means the trader passed the firm’s evaluation requirements for that period. This does not prove long term profitability, or that the same strategy will survive different market conditions.
What should a beginner do in the first 30 days?
Concentrate on the process, not the income. Define strategy. Log trades. Calculate real risk. Understand firm’s drawdown rules. Review rule compliance. A short run of profitability is no reason to increase your position size.